Venn diagrams are made up of 2 or more overlapping circles, which are used to visually compare and contrast information and to examine relationships.
Venn diagrams are good because they show the set of values as well as the relationship between the different sets.
In the example below, 3 sets are shown (users on LinkedIn, users on Pinterest, and users on Twitter) and the relationship between the 3. The realationship is people who use both Twitter and Pinterest (area of T,P), people who use all three (area of T,P,L), etc.
Venn diagrams allow us to get the union of sets, intersection of sets as well as the difference. A Venn Diagram is simple if at most 2 curves intersect at a single point in the plane.
The requirement that the curve is closed means that each curve may not cross with itself (so it should look like a circle and not look like a figure 8.
The Venn diagram is connected means that there is only one region resulting from the intersection of any 2 closed curves and that one curve may enclose only one region.
With these connected graphs we are able to determine a minimum dominating set.

The above Venn diagram in our adjacency list format is
6
4 1 2 3 5
4 0 2 3 4
4 1 4 5 0
4 0 1 4 5
4 1 2 3 5
4 0 2 3 4
The above image shows a 3-Venn diagram with (23)=8 faces and with 6 ((23)-2) intersecting points (vertices). An example of a minimum dominating set is {2,3}.
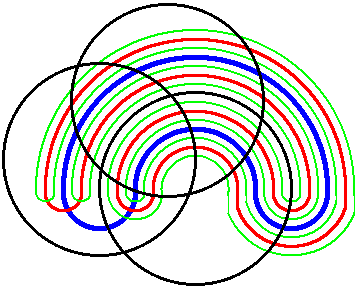
The 3-Venn diagram is one that is seen by many people usually introduced in a statistics class. A further addition to the 3-Venn diagram is a 6-Venn diagram as shown below which is from Frank Ruskey's website.

The 6-Venn diagram is drawn by first drawing a 3-Venn diagram and then drawing the blue U shaped figure which gives a 4-Venn. The 5-Venn is drawn by drawing the red shaped figure so that it traces along the blue figure by dividing each existing region in two. The 6-Venn follows the same pattern by the green shape tracing the red figure again dividing each existing region in two.
The Venn Diagram input files provided by Dr. Myrvold can be found here
The first link are 3-Venn diagrams which have 6 vertices
The second link are 4-Venn diagrams which have (24)-2, 14, vertices.
The third link are 5-Venn diagrams which have (25)-2 or 30 vertices
The fourth link are 6-Venn diagrams which have (26)-2 or 62 vertices